Bear Flag Pattern: What It Is & How Traders Use It

Key Takeaways
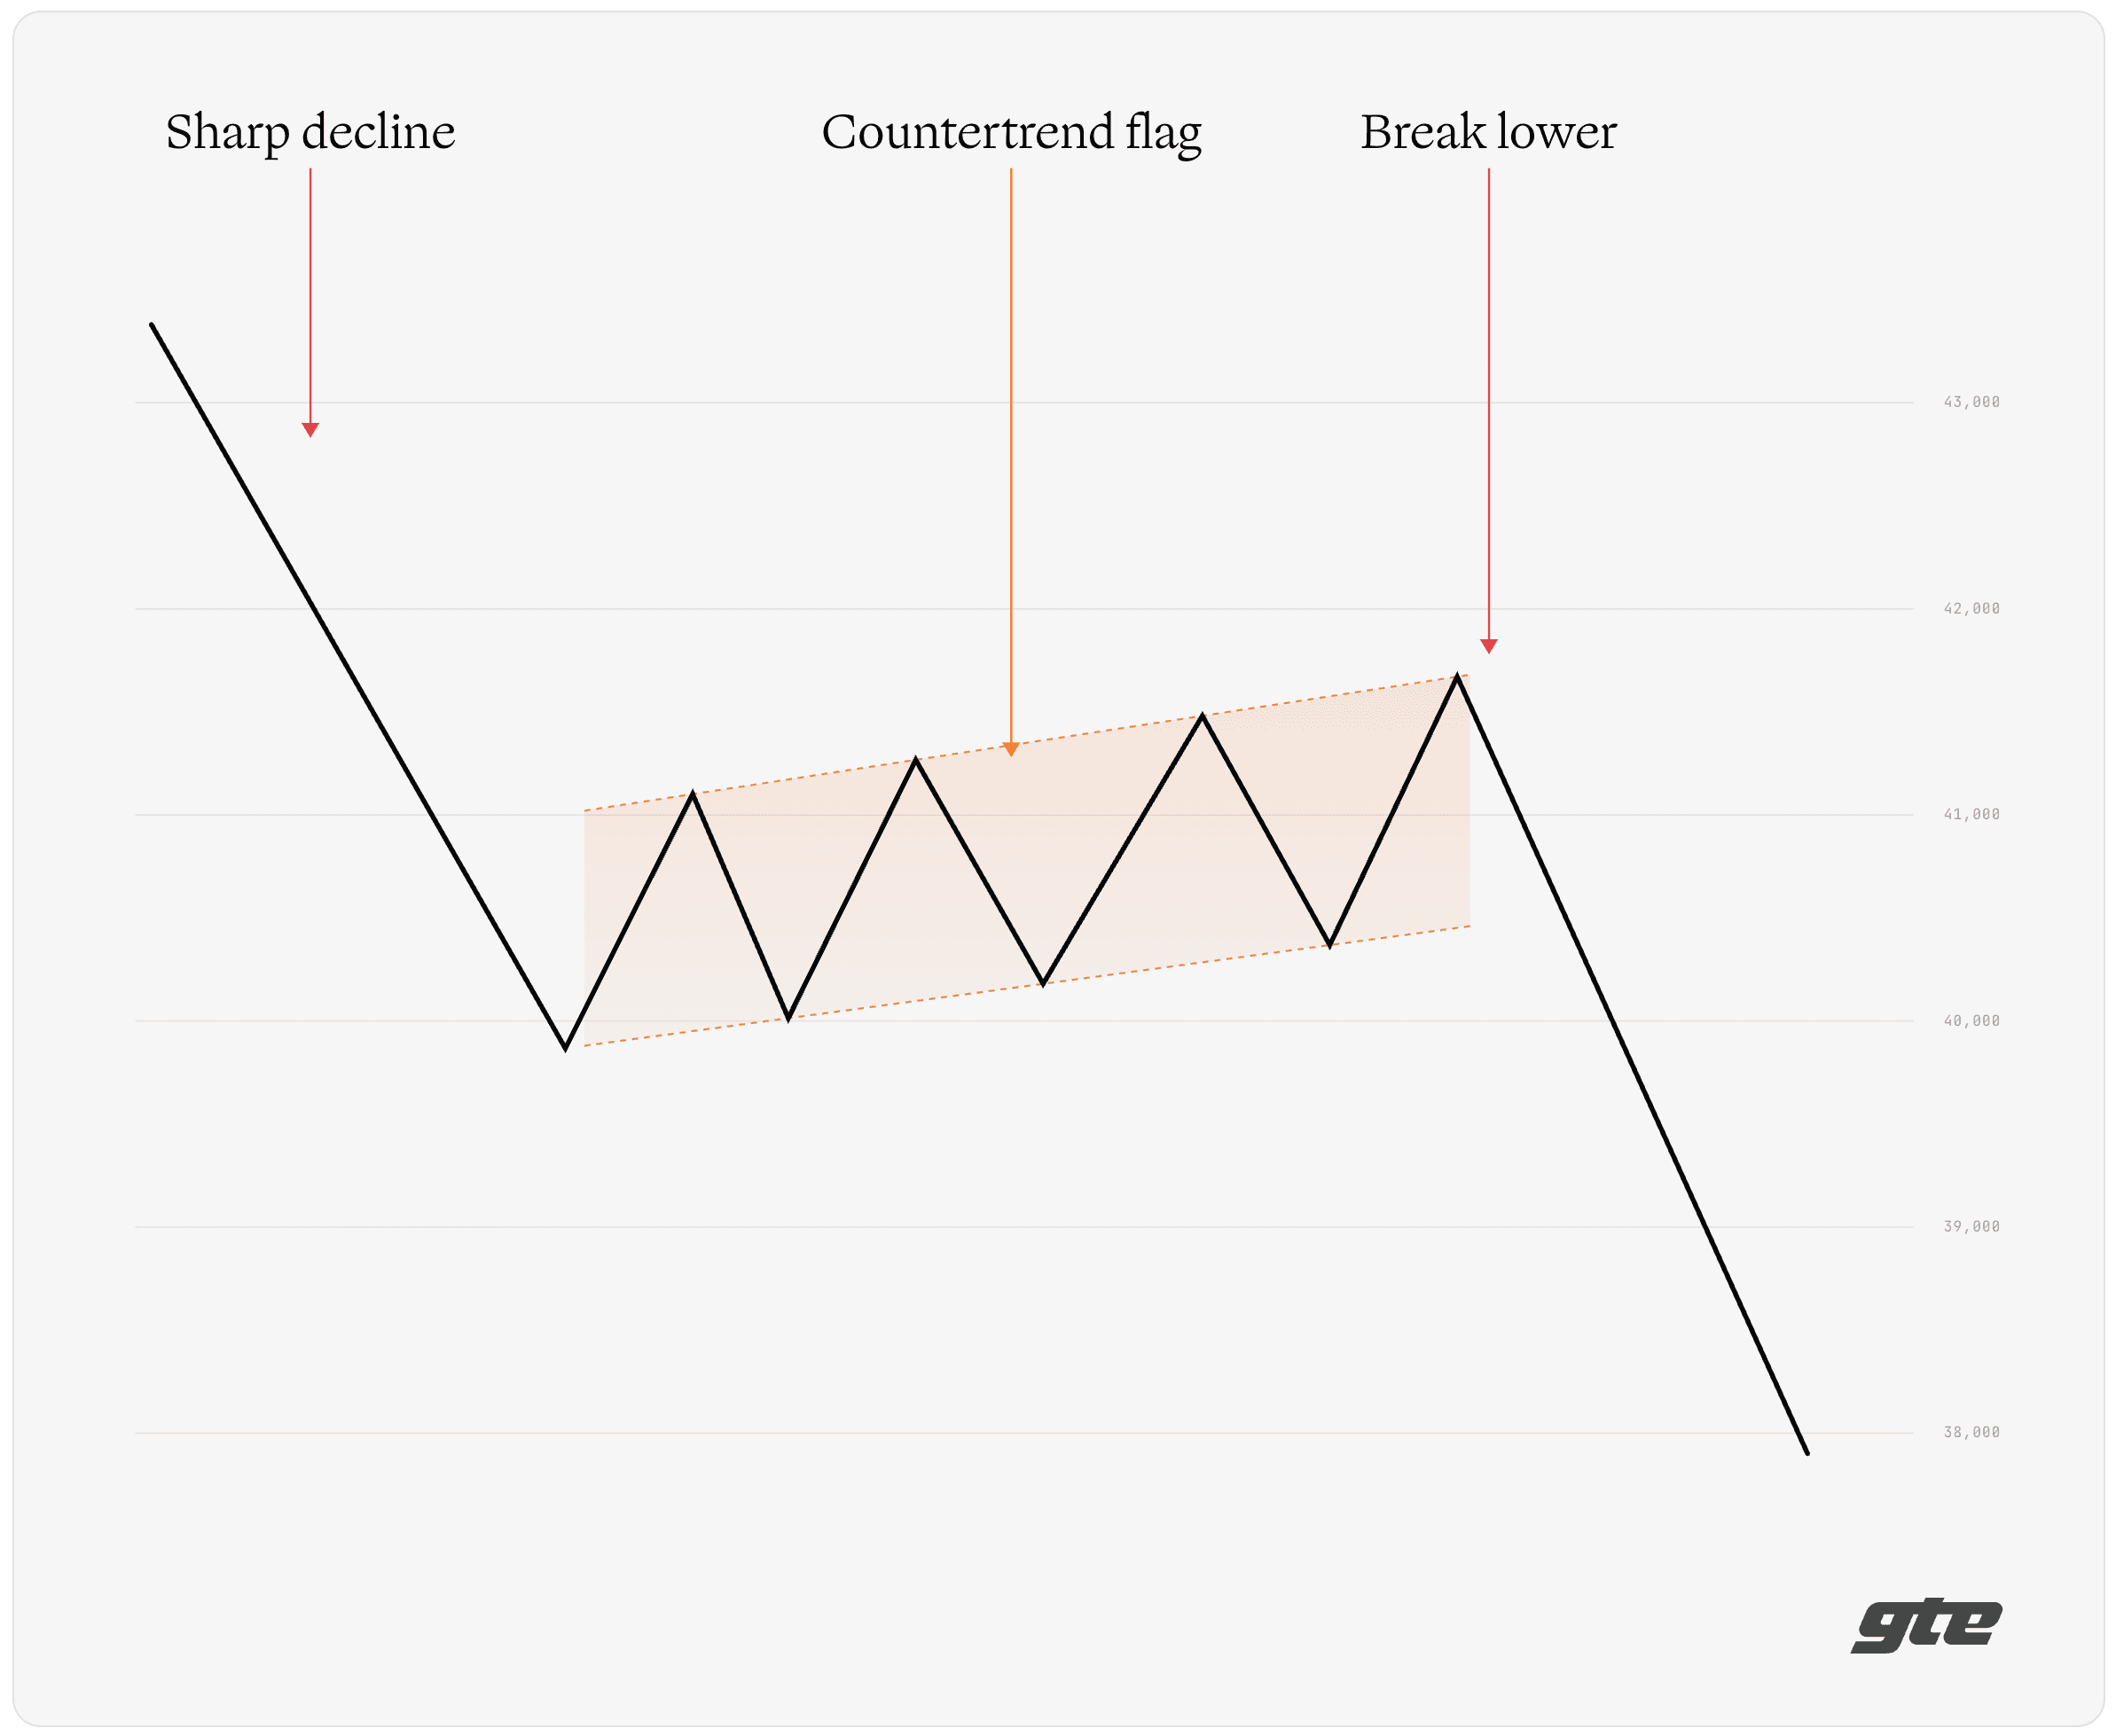
A bear flag pattern is a bearish continuation setup that forms after a sharp decline. The flagpole is the initial drop; the flag is the smaller upward or sideways consolidation that follows.
Traders typically watch a bear flag for signs that downside momentum may continue, but the pattern is not a prediction. The pause alone does not confirm the setup.
The lower boundary of the flag is commonly watched for breakdown confirmation, while the upper boundary is often treated as an invalidation area. A move back above the flag can weaken or negate the bearish continuation read.
Bear flag target estimates are often based on a measured move, using some or all of the flagpole's length. That projection is a reference point, not a guarantee or forecast.
Bear flags can fail when a breakdown quickly reclaims the flag channel, volume does not support the move, broader market conditions shift, or crypto wicks and liquidity gaps distort the chart.
What is a bear flag pattern?
After a sharp selloff, the hard question is whether a bounce is the start of a recovery or just a pause before another move lower. A bear flag pattern gives traders a way to frame that question by separating the initial drop, the countertrend channel, and the level where the setup either confirms or fails.
A bear flag pattern is a bearish continuation pattern that forms when price drops sharply, consolidates in a smaller upward or sideways channel, and then breaks below that channel. Traders who identify one are watching for evidence that the downtrend may resume, rather than reverse.
The pattern is described as a continuation setup because the dominant read is that the pause represents a temporary lull in selling pressure rather than a genuine change in direction. Whether that reading proves correct depends on the setup, broader market context, and what price does next. A bear flag can help a trader form a market bias, but it is only one tool for organizing evidence and is not enough on its own.
A simplified bear flag pattern showing a sharp decline, countertrend flag, and potential break lower.
Bear flag pattern anatomy
A bear flag diagram showing the flagpole, upper and lower flag boundaries, invalidation area, and breakdown area.
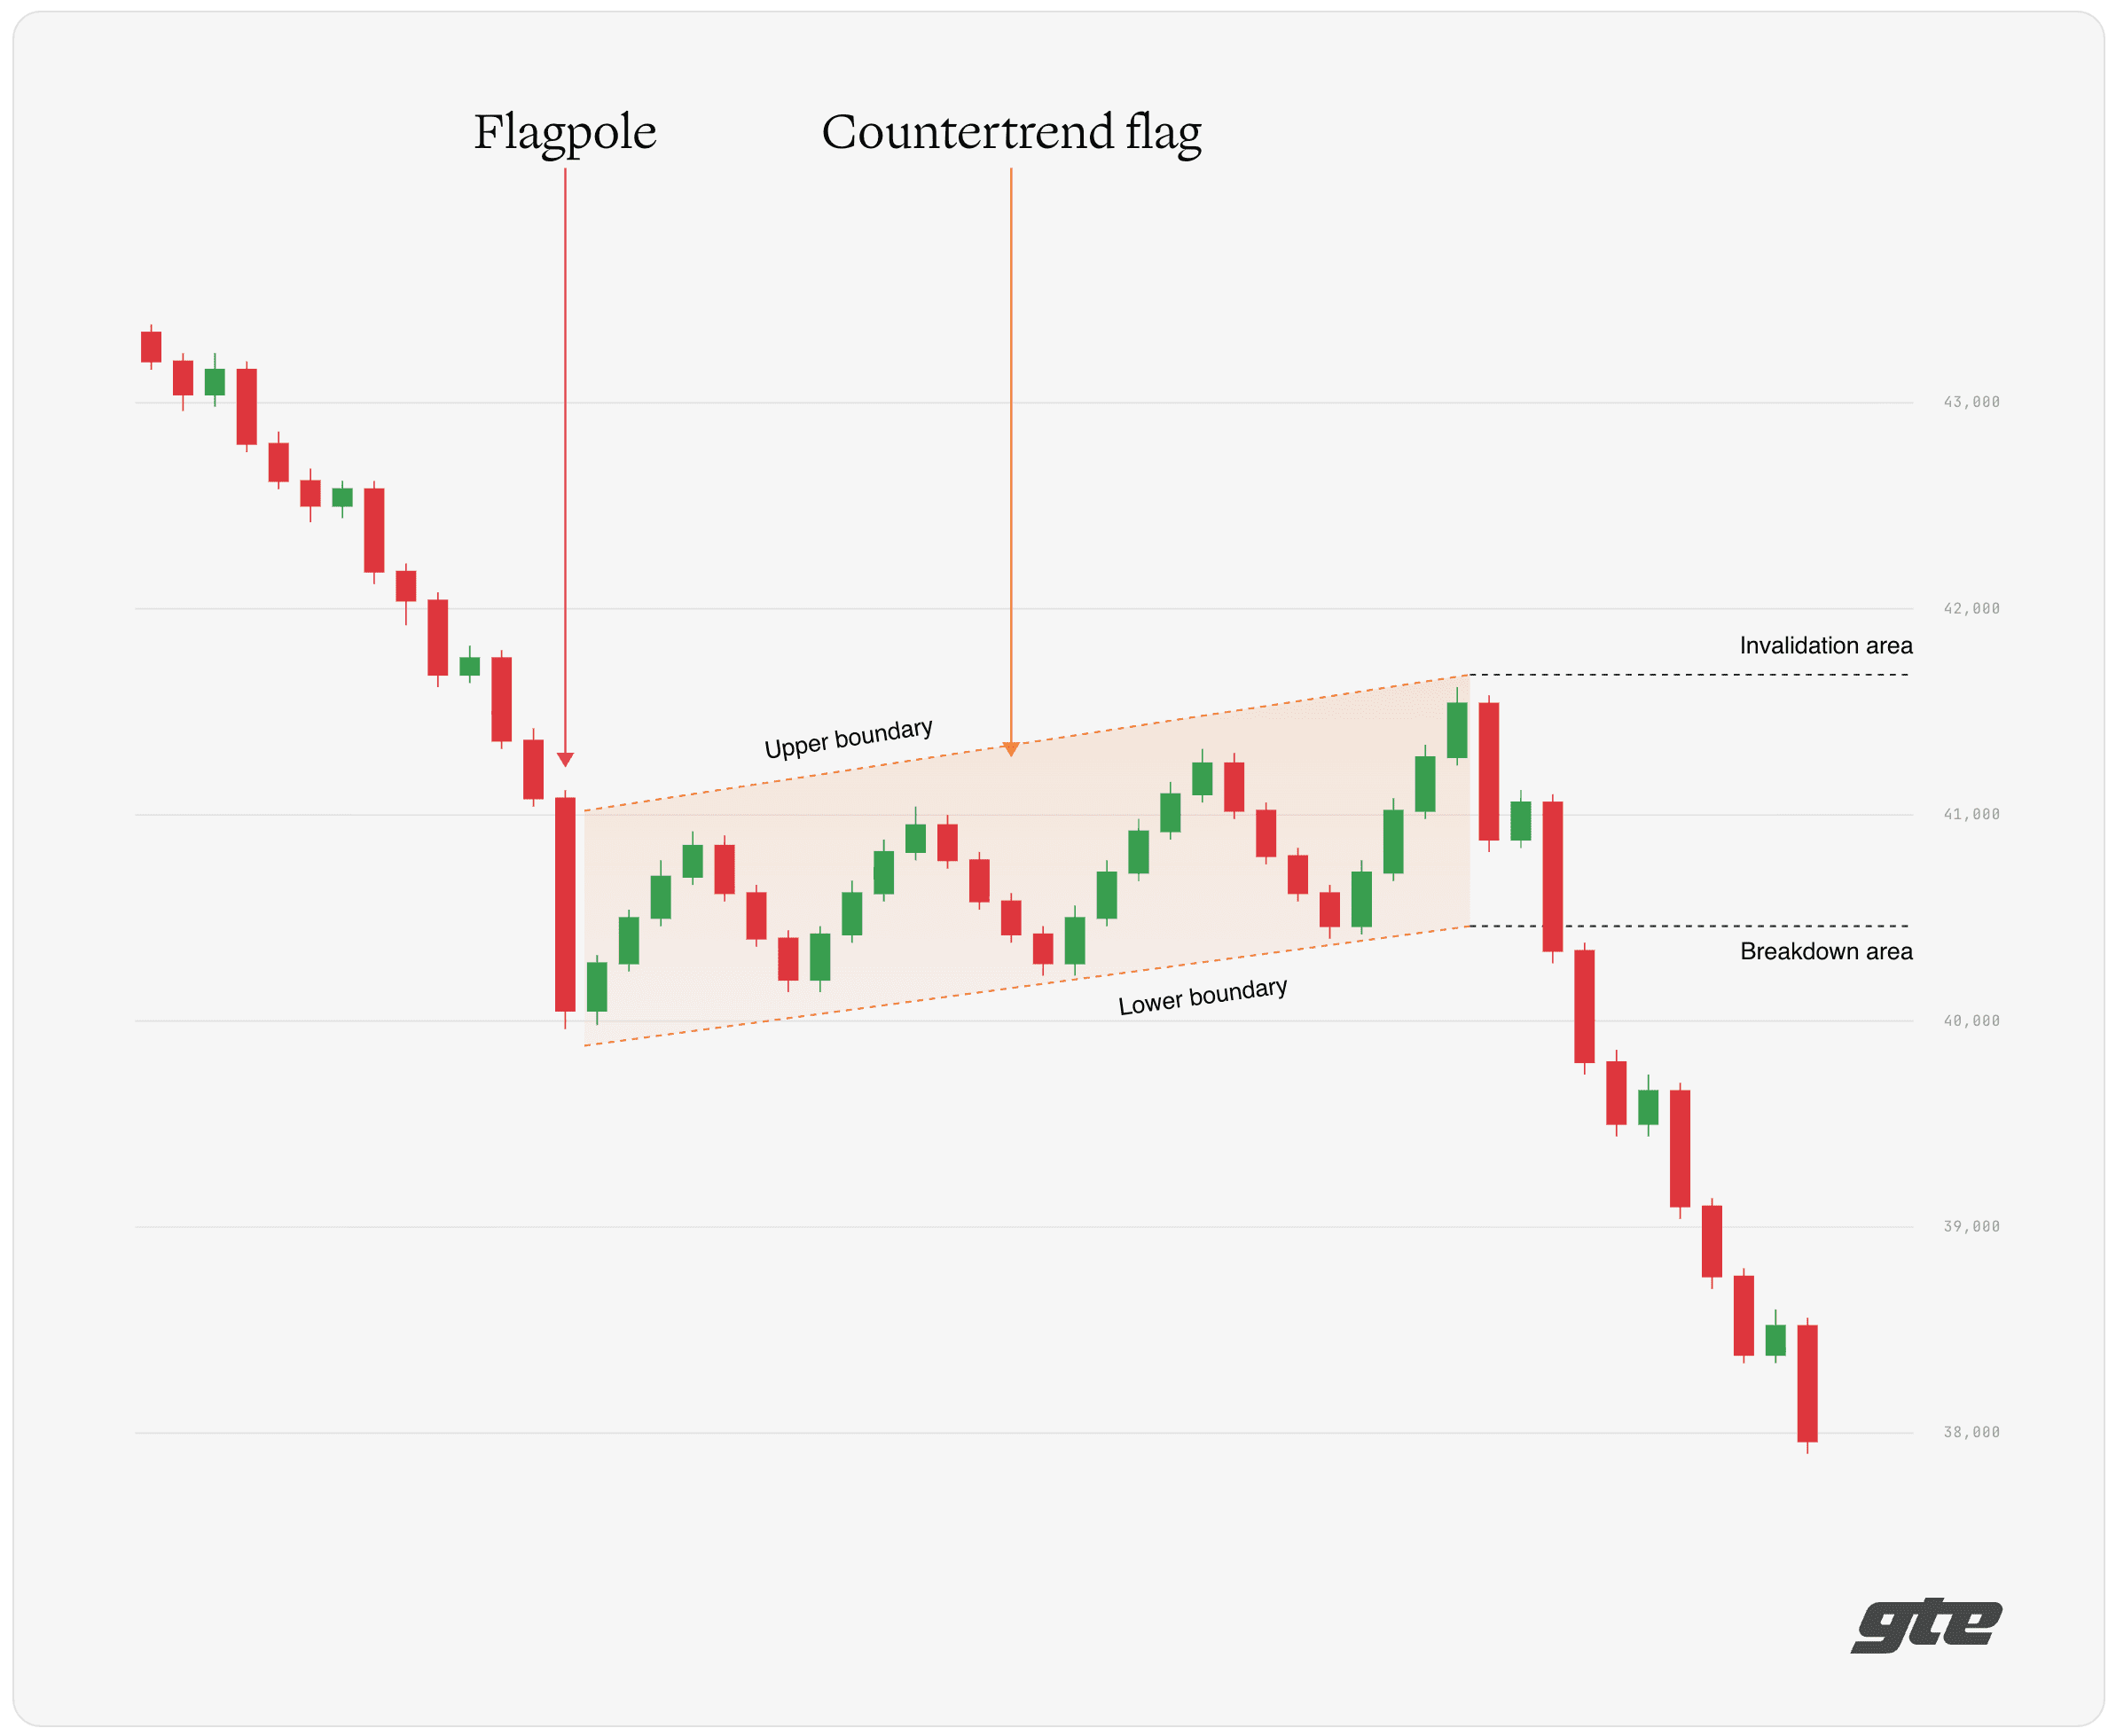
A bear flag has five recognizable components.
Flagpole: The sharp decline that precedes the flag. A useful flagpole is typically steep and fast, covering a meaningful price range in a relatively short time. A gradual, choppy decline does not produce the same setup because the prior move lacks the definition that makes the subsequent pause meaningful. The length and character of the flagpole also inform how traders approach the measured-move estimate later.
Flag channel: The consolidation phase that forms after the flagpole. Price lifts slightly or moves sideways in a relatively tight, bounded range. The channel walls are usually parallel or near-parallel, often slanting upward against the prior trend. The key characteristic is control. A shallow, boxed-in bounce fits the flag read; a wide, forceful recovery starts to look like a different chart.
Breakdown area: The lower boundary of the flag channel is what traders commonly watch for confirmation. A close below that boundary is often treated as evidence that the original decline may be resuming, especially when the move holds on the relevant timeframe.
Invalidation area: The upper boundary of the flag channel, and beyond it the top of the flagpole, serves as a practical invalidation zone. If price breaks clearly above the flag and holds there, the bearish continuation read no longer applies in the same way. A deeper recovery toward or above the flagpole's origin suggests something more than a temporary pause may be occurring.
Volume and timeframe context: Volume often expands during the flagpole decline, contracts during consolidation, and may expand again if price breaks below the flag. That sequence can add weight to the read, though it is not required and can be harder to interpret cleanly in 24/7 crypto markets. Timeframe matters too: smaller patterns produce more noise, while larger ones tend to have fewer but more visible setups.
How a bear flag forms
The sequence starts with a fast, sustained price decline. The speed and clarity of that initial move matter because the entire bear flag thesis rests on it. Without a distinct flagpole, the subsequent pause has no clean reference point.
After the sharp move, the chart may show selling pressure easing. Price stabilizes or bounces modestly, which traders often interpret as short covering, reassessment, or short-term buying rather than a confirmed trend reversal. That buying pressure is typically described as weak or countertrend because it is not supported by a clear change in trend direction. The result is a channel that climbs against the prior move but does so in a shallow, orderly way rather than a forceful reversal.
At some point, the channel resolves. If selling pressure returns and price breaks below the lower channel boundary, traders who were watching the setup treat that as potential follow-through from the original decline. If buyers prove stronger, price can break above the channel or reverse through the flagpole, and the bear flag read no longer applies.
This sequence is sometimes interpreted as sellers pausing, buyers testing the bounce, and sellers returning if the flag breaks down. That framing is useful for understanding why the pattern looks the way it does. But psychology is not directly observable in a chart. What is observable is price behavior, volume participation, and whether the structure holds long enough to form a recognizable pattern.
What traders look for in a bear flag
Not every bounce after a decline is a bear flag. A useful pattern needs a sharp prior move, a controlled pause that forms recognizable boundaries, and a level that can be evaluated as either confirmation or invalidation. This is where many bad bear-flag reads start: the bounce is drawable, but the prior drop was not clean enough to make the pattern meaningful.
The table below summarizes the elements that traders commonly examine when evaluating a potential bear flag.
Element | What traders look for | Why it matters |
|---|---|---|
Prior decline | Sharp decline before the flag | Establishes the bearish context and defines the flagpole |
Flag channel | Smaller countertrend or sideways pause with recognizable boundaries | Shows the market pausing rather than reversing |
Lower boundary | Move below the lower flag boundary, ideally with follow-through | Common confirmation signal that the prior trend may be resuming |
Upper boundary | Reclaim above the flag channel, or a deeper recovery toward the flagpole's origin | Suggests the continuation setup has failed or materially weakened |
Context | Volume, timeframe, broader trend, volatility, and market conditions | Helps separate a credible setup from noise |
Beyond the structure itself, traders often consider how the flag channel behaves over time. A flag that grinds higher and expands in range is less consistent with the classic setup. A flag that stays tight and contained tends to be read as a more disciplined consolidation.
Volume context is worth watching separately. A common pattern is that volume contracts during the flag after being elevated during the flagpole. When volume then expands around a breakdown, some traders treat that as additional evidence that sellers are returning. When volume is flat or inconsistent on a breakdown, the signal is considered less clear.
Confirmation and invalidation
A bear flag can look obvious while it is still forming. It is not confirmed just because the channel is visible; the important question is how price behaves at the channel boundary.
A commonly watched confirmation cue is a move below the lower boundary of the flag channel, especially if price closes below that level and does not immediately reclaim it. A single wick below the boundary without a close tends to be treated with more skepticism because wicks can reflect momentary liquidity grabs rather than directional follow-through.
This is especially relevant in crypto markets, where price can breach a level sharply during a low-liquidity window and then recover within the same session. In those cases, a candle close and follow-through provide more structure than a wick breach alone.
Invalidation follows a parallel logic. If price breaks above the upper boundary of the flag and holds there, traders often treat the bear flag setup as no longer valid. A move back above the flagpole's starting point is a stronger form of invalidation because it may suggest buyers have absorbed enough of the prior selling pressure to change the read. Beyond that, broader context can invalidate a pattern without price touching the technical boundaries: a sharp market-wide rally, a major macro event, or a sudden shift in liquidity conditions can all change the environment in which the setup was forming.
False breakdowns are a recognized risk. A price move below the channel that looks like confirmation but quickly reverses into or above the flag can turn a bearish continuation read into a failed setup. That is why follow-through is part of how traders commonly describe confirmation.
Bear flag measured move: how target estimates are commonly framed
Once a bear flag breaks down, traders often use the flagpole's length as a rough guide for estimating where the move might go. This is commonly called the measured move.
The basic approach is to measure the length of the flagpole (the distance from the start of the sharp decline to the bottom of that decline, before the flag began), and then project that distance from the breakdown point. If a flagpole drops from $100 to $80, the flagpole length is $20. If price then consolidates in a flag between $80 and $84 and breaks below $80, a full flagpole projection would point toward a potential area near $60. A half-flagpole projection would suggest the $70 area.
Some traders use the full flagpole. Others use a fraction. Neither approach carries a guarantee, and practitioners disagree on the right multiplier depending on timeframe, volatility, and the character of the prior move.
The measured move is best understood as a reference area, not a price destination. Price can stop short, continue beyond the estimate, or reverse well before getting there. Treating the measured move as a prediction rather than a reference is one of the more common misapplications of the pattern.
Why bear flags fail
Bear flags fail with enough regularity that the failure mode is part of understanding the setup. A few patterns appear consistently.
False breakdown that reclaims the channel. A price move below the lower flag boundary triggers what looks like confirmation, but price quickly climbs back into or above the channel. This is a common failure mode in crypto markets, where thin liquidity, wick behavior, and liquidation-driven moves can briefly push price through a level without durable follow-through.
Broad-market context reversal. A bear flag setup forming during broad selling pressure can be neutralized by a market-wide shift. If the broader market moves higher sharply, individual setups that looked like bearish continuations may resolve in the opposite direction.
Pattern drawn without enough prior context. A flag needs a distinct flagpole. When a trader draws a bear flag on a modest, gradual decline, the structure lacks the clarity that makes the pattern meaningful.
Low-liquidity wicks treated as confirmation. Crypto markets trade around the clock across many venues with uneven liquidity. A breakdown candle that forms in a low-volume window and immediately reverses may reflect a liquidity gap rather than a directional move.
Volume doesn't support the breakdown. When a price break below the channel occurs on thin volume, with no follow-through in subsequent candles, the selling pressure implied by the pattern may not actually be present.
Reversal building inside the flag. Sometimes what looks like a consolidation flag is actually a base. Price makes successively higher lows, the chart may suggest buyers are absorbing more of each decline, and the structure evolves into something that looks more like accumulation than a pause in selling. Once higher lows become clear, the case for bearish continuation weakens.
Bear flag vs similar patterns
A few bearish-looking structures can be mistaken for a bear flag, and the distinction matters because the setup and what traders watch for can differ.
Pattern | Shape | Key distinction |
|---|---|---|
Bear flag | Parallel or near-parallel consolidation after a sharp drop | Continuation setup after a flagpole; channel is the key structural feature |
Bear pennant | Small converging consolidation after a sharp drop | Compression into a narrowing point rather than a channel; both walls slope inward |
Descending triangle | Flat support with a series of lower highs | A support-test structure; not necessarily tied to a flagpole and operates differently across timeframes |
Reversal base | Price stops falling and begins building higher lows | Higher lows and broader stabilization can weaken the bearish continuation read |
The main distinction is shape and context. Flags have parallel or near-parallel channels after a flagpole; pennants compress toward a point; descending triangles test support with lower highs; and reversal bases begin to build higher lows.
The bull flag is the inverse concept. It forms after a sharp rally, pauses in a downward or sideways channel, and is read as potential bullish continuation when price breaks above the flag.
Common mistakes when reading bear flags
Treating any pullback in a downtrend as a bear flag. A downtrend contains many pullbacks. Most of them are not bear flags. The pattern requires a specific structure: a sharp prior move that forms a clear flagpole, a consolidation phase with recognizable channel boundaries, and a level that functions as either confirmation or invalidation. A vague bounce in a downtrend without those features is just a bounce.
Ignoring the invalidation level. A bear flag setup comes with a built-in disconfirmation level: the upper boundary of the flag, and beyond it the start of the flagpole. Traders who identify the pattern but don't track when it has been negated can remain in a bearish read long after the structure has broken down in the opposite direction.
Reading the pattern without trend context. A bear flag that forms during a broader uptrend or near major support is different from one that forms during a clear downtrend with no nearby support. The pattern alone does not carry enough information to determine whether the setup is credible.
Treating the measured move as a promise. The flagpole projection is one way to estimate where a move might go. It is not a floor, a ceiling, or a guarantee. Markets can stop short, overshoot, or ignore the implied target.
Mistaking a reversal base for a continuation flag. Not every bounce after a decline is a pause. Some bounces are the beginning of a reversal. When successive swings inside a consolidation produce higher lows, the pattern may be building a base rather than flagging before further downside. The distinction becomes clearer over time, but traders who label a setup too early can lock in a bearish read before the evidence is complete.
