Bull Flag Pattern: What It Is & How Traders Use It

Key Takeaways
A bull flag pattern is a bullish continuation setup that forms after a sharp rally. The flagpole is the initial advance; the flag is the smaller downward or sideways consolidation that follows.
A bull flag is usually read in three parts: the prior uptrend, the controlled pause, and a potential breakout above the flag. The pause alone does not confirm the pattern.
Traders often watch the upper boundary of the flag for breakout confirmation and the lower boundary for invalidation. A move below the flag can weaken or negate the bullish continuation read.
Bull flag target estimates are framed by projecting some or all of the flagpole from the breakout area. That measured move is a reference point, not a guarantee or forecast.
Stronger bull-flag reads combine structure, context, and follow-through; loose channels, thin volume, weak breakouts, or exhaustion-style rallies can all undermine the setup.
What is a bull flag pattern?
After a sharp rally, the hard question is whether the pause that follows is consolidation before another leg higher or the first sign that the move is running out of fuel. A bull flag pattern gives traders a way to frame that question by separating the initial advance, the consolidation channel, and the level where the setup either confirms or fails.
A bull flag pattern is a bullish continuation pattern that starts with a sharp price rise and a smaller downward or sideways consolidation; the continuation read is usually treated as confirmed only if price breaks above that channel and holds. Simply put, the pattern is a rally, a pause, and then a test of whether the rally can continue. Traders who identify one are watching for evidence that the uptrend may resume, rather than reverse.
The pattern is described as a continuation setup because the dominant read is that the pause represents a temporary cooling of buying pressure rather than a genuine change in direction. Whether that reading proves correct depends on the setup, broader market context, and what price does next. A bull flag can help a trader form a market bias, but it is only one tool for organizing evidence and is not enough on its own.
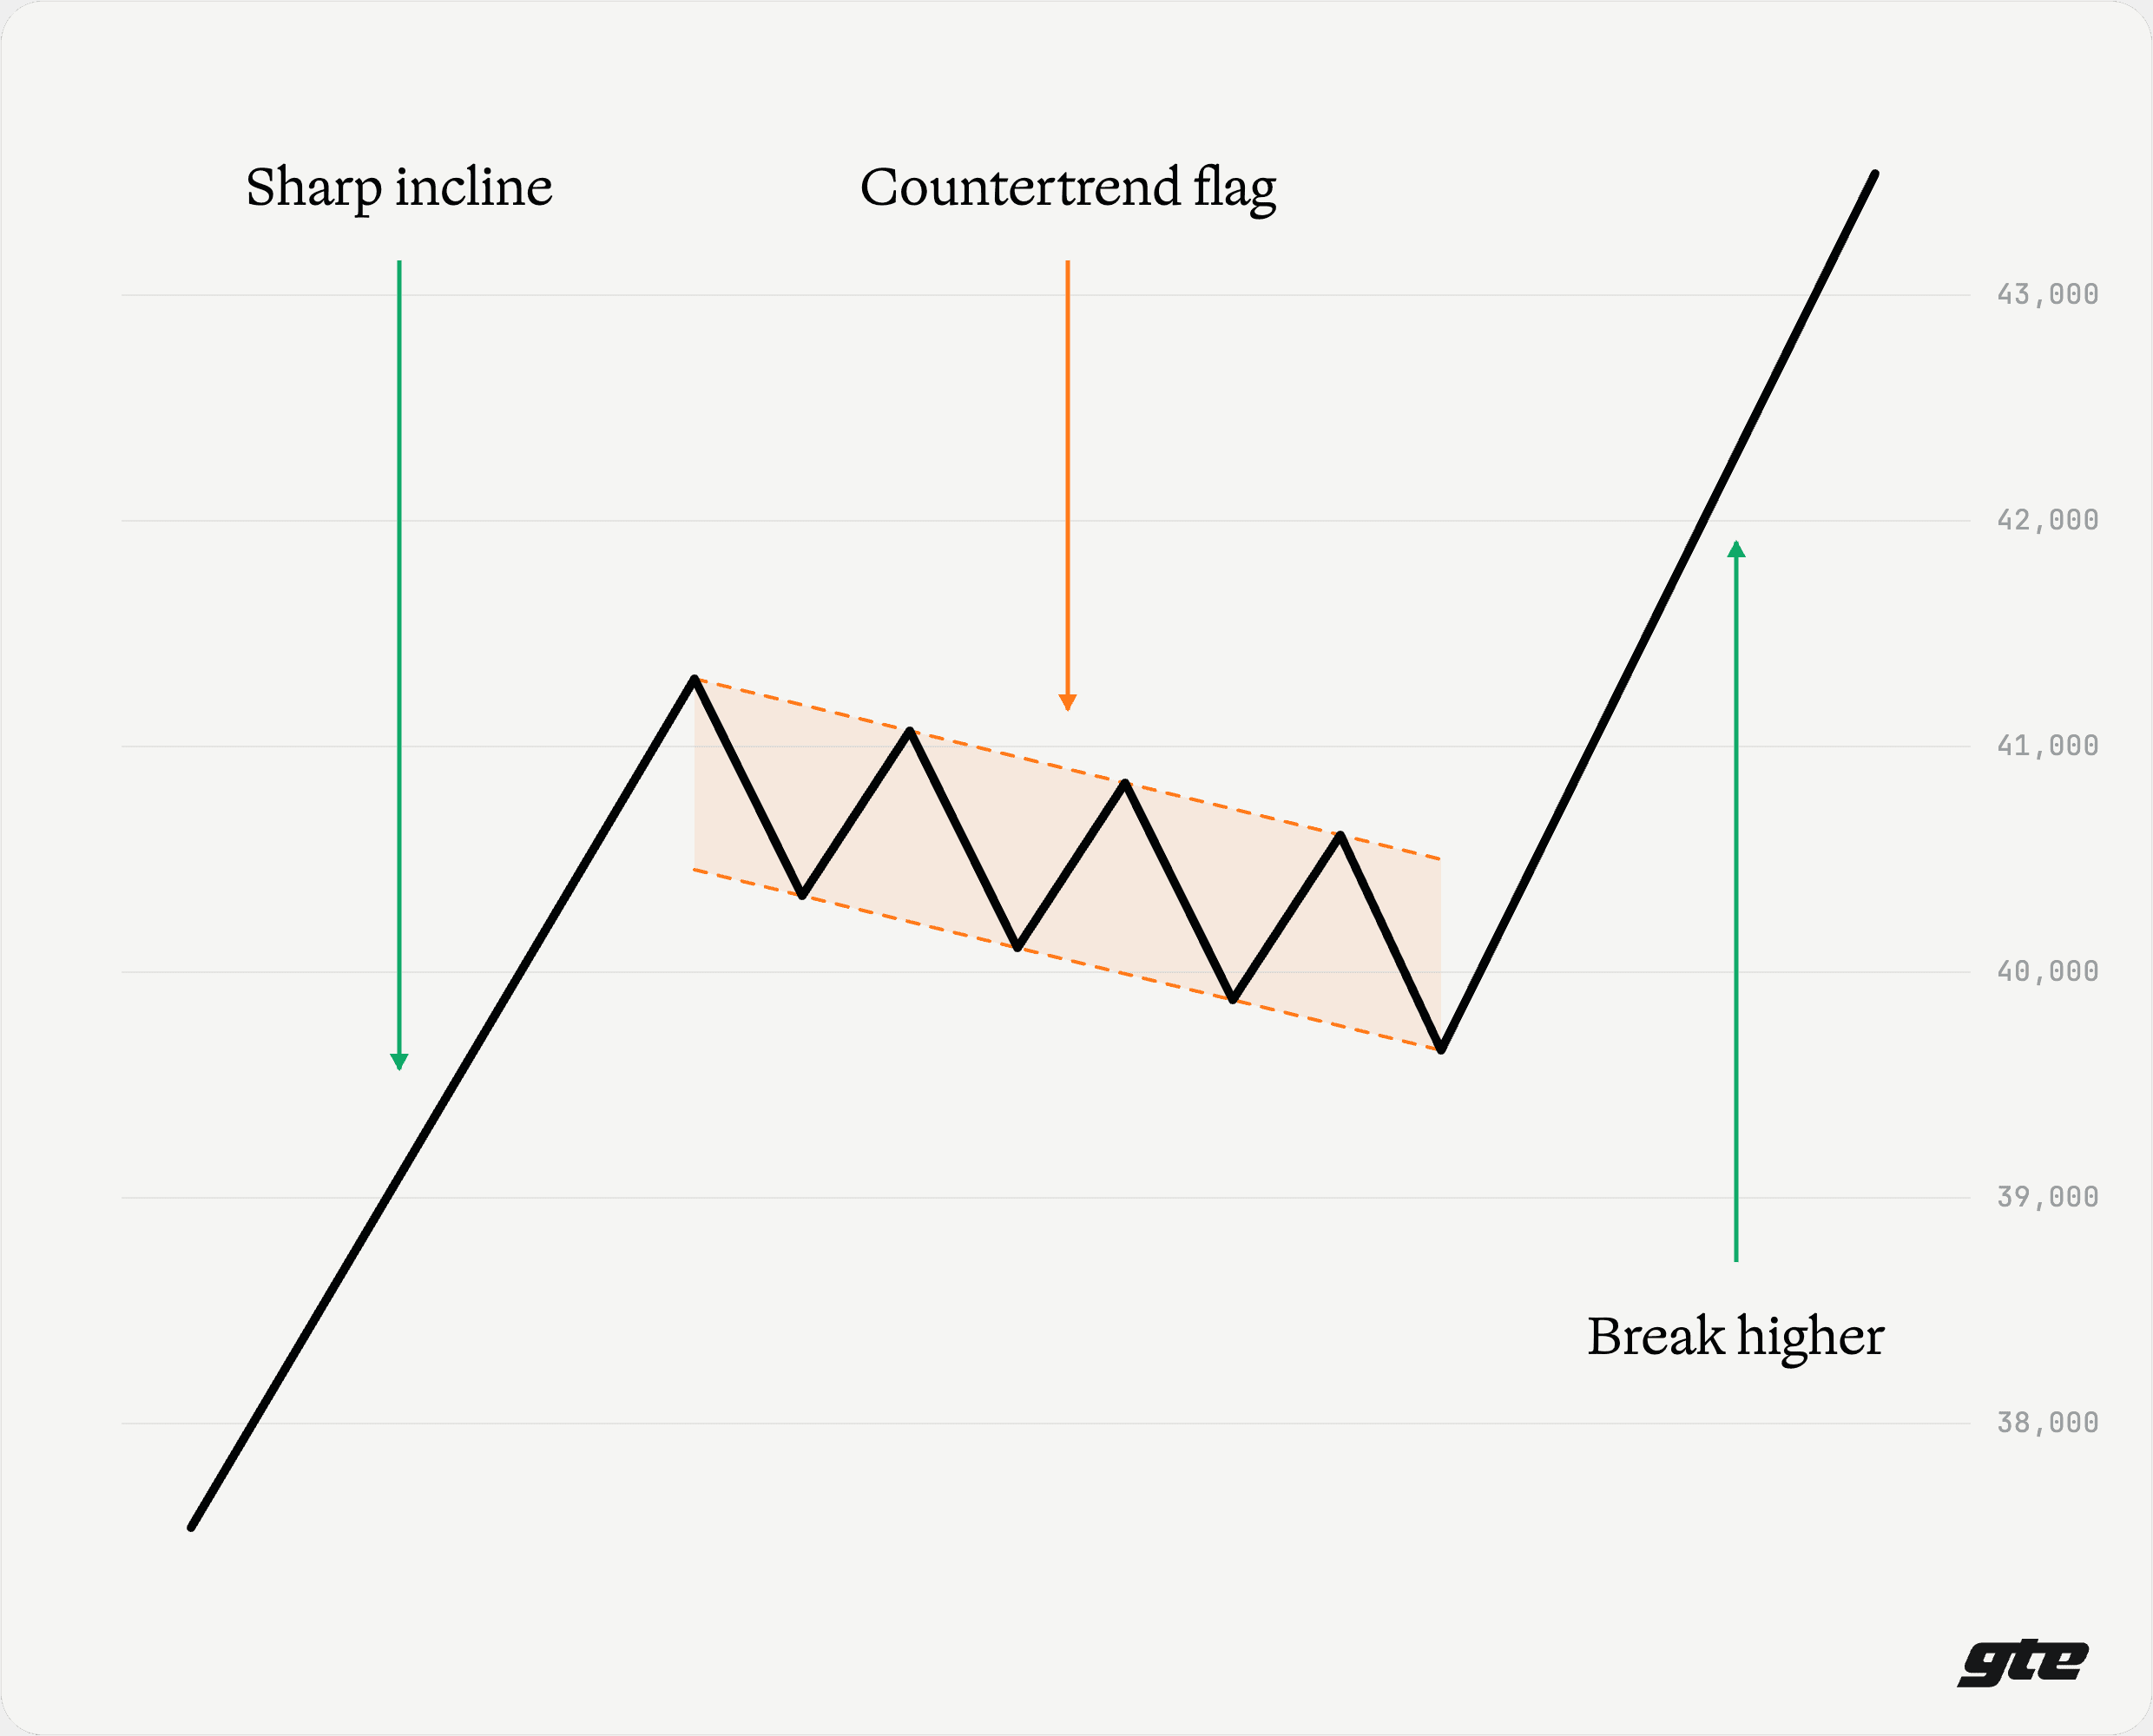
A bull flag starts with a sharp advance, then forms a smaller countertrend flag before a potential break higher.
Bull flag pattern anatomy
A bull flag has five recognizable components.
Flagpole: The sharp advance that precedes the flag. A useful flagpole is typically steep and fast, covering a meaningful price range quickly. A gradual, choppy climb does not produce the same setup because the prior move lacks the definition that makes the subsequent pause meaningful. The length and character of the flagpole also inform how traders approach the measured-move estimate later.
Flag channel: The consolidation phase that forms after the flagpole. Price drifts slightly lower or moves sideways in a relatively tight, bounded range. The channel walls are usually parallel or near-parallel, often slanting downward against the prior trend. The key characteristic is control. A shallow, boxed-in pullback fits the flag read; a deep, forceful selloff starts to look like a different chart.
Breakout area: The upper boundary of the flag channel is what traders commonly watch for confirmation. A close above that boundary is often treated as evidence that the original advance may be resuming, especially when the move holds on the relevant timeframe.
Invalidation area: The lower boundary of the flag channel, and beyond it a deeper move back into the flagpole, serves as a practical invalidation zone. If price breaks clearly below the flag and stays there, the bullish continuation read no longer applies in the same way. A drop toward or below the flagpole's origin, the area where the sharp advance began, suggests something more than a temporary pause may be occurring.
Volume and timeframe context: Volume often expands during the flagpole advance, contracts during consolidation, and may expand again if price breaks above the flag. That sequence can add weight to the read, though it is not required and is not always clean in practice. Timeframe matters too: smaller patterns produce more noise, while larger ones tend to have fewer but more visible setups.
For a stronger read, the parts should work together: clear pole, controlled flag, and a breakout area that is easy to distinguish from normal channel noise.
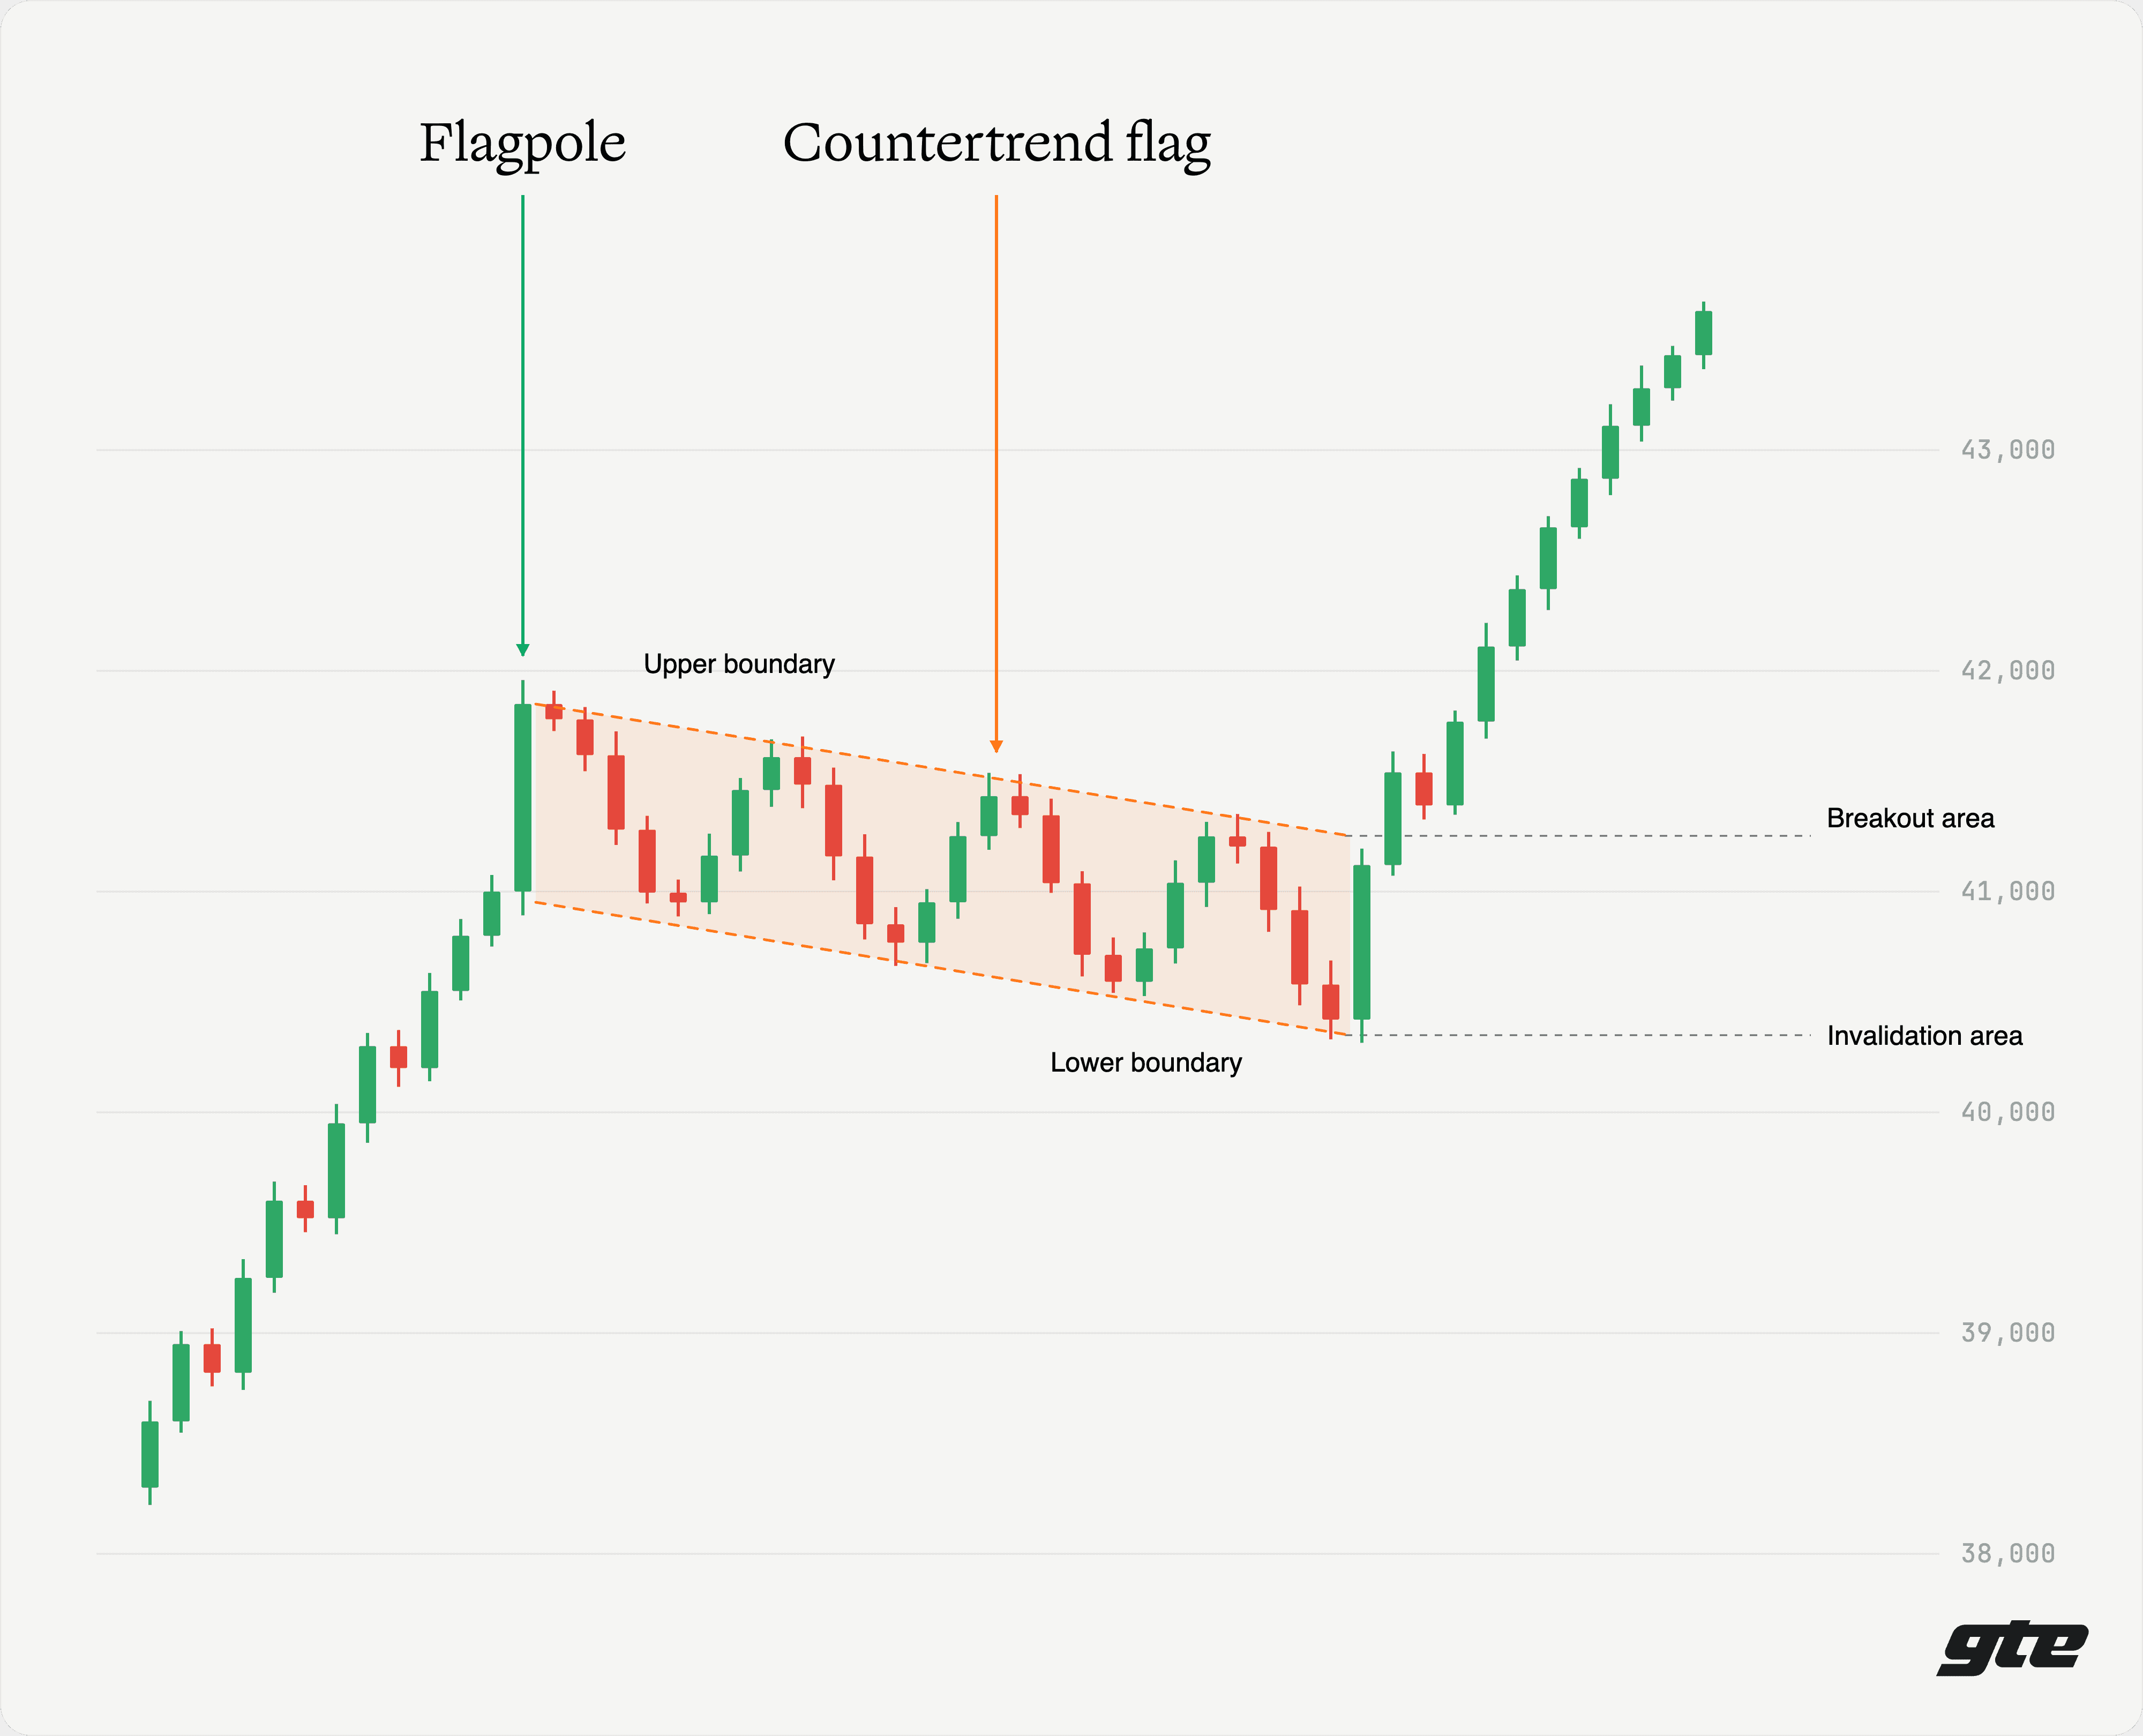
A detailed bull flag view highlights the flagpole, upper and lower boundaries, breakout area, and invalidation area traders commonly watch.
How a bull flag forms
The sequence starts with a fast, sustained price advance. The speed and clarity of that initial move matter because the entire bull flag thesis rests on it. Without a distinct flagpole, the subsequent pause has no clean reference point.
One simple way to frame the pattern is in three phases: the flagpole, the flag, and the resolution. The flagpole is the sharp rally. The flag is the controlled pullback or sideways pause. The resolution is the breakout attempt, where price either follows through above the flag or fails and falls back into the structure.
After the sharp move, the chart may show buying pressure cooling. Price drifts lower or stalls, which traders often interpret as profit-taking, a brief reassessment, or short-term selling rather than a confirmed trend reversal. That selling pressure is typically described as weak or countertrend because it is not supported by a clear change in trend direction. The result is a channel that leans against the prior move but does so in a shallow, orderly way rather than a forceful reversal.
The quality of that pause matters. A short, contained flag suggests rest within the prior trend; a long, wide, choppy flag can start to look more like distribution or uncertainty.
At some point, the channel resolves. If buying pressure returns and price breaks above the upper channel boundary, traders who were watching the setup treat that as potential follow-through from the original advance. If sellers prove stronger, price can break below the channel or unwind back through the flagpole, and the bull flag read no longer applies.
This sequence is sometimes interpreted as buyers pausing, sellers testing the pullback, and buyers returning if the flag breaks out. That framing is useful for understanding why the pattern looks the way it does. But psychology is not directly observable in a chart. What is observable is price behavior, volume participation, and whether the structure holds long enough to form a recognizable pattern.
What traders look for in a bull flag
Not every pullback after a rally is a bull flag. A useful pattern needs a sharp prior move, a controlled pause that forms recognizable boundaries, and a level that can be evaluated as either confirmation or invalidation.
Simple reading order: look for the sharp rally, then the controlled channel, then the level where price either resolves above the flag or breaks the structure.
The table below summarizes the elements that traders commonly examine when evaluating a potential bull flag.
Element | What traders look for | Why it matters |
|---|---|---|
Prior move | Sharp rally before the flag | Establishes the bullish context and defines the flagpole |
Flag channel | Smaller pullback or sideways pause with recognizable boundaries | Shows the market pausing rather than fully reversing |
Upper boundary | Move above the upper flag boundary, ideally with follow-through | Common confirmation signal that the prior trend may be resuming |
Lower boundary | Breakdown below the flag, or a deeper move into the flagpole | Suggests the continuation setup has failed or materially weakened |
Context | Volume, timeframe, broader trend, volatility, and market conditions | Helps separate a credible setup from noise |
Beyond the structure itself, traders often consider how the flag channel behaves over time. A flag that sells off hard and expands in range is less consistent with the classic setup. A flag that stays tight and contained, giving back only part of the flagpole, tends to be read as a more disciplined consolidation.
Retracement depth is another useful filter. A flag that gives back a small portion of the flagpole keeps the continuation read cleaner; a deeper retracement asks more from the later breakout.
Volume can add context. A common sequence is elevated volume during the flagpole, quieter activity during consolidation, and renewed participation around the breakout. If the breakout comes on thin or fading volume, the continuation read is usually less convincing.
Confirmation and invalidation
A bull flag can look obvious while it is still forming, but the visible channel alone does not confirm it. The important question is how price behaves at the channel boundary.
A commonly watched confirmation cue is a move above the upper boundary of the flag channel, especially if price closes above that level and holds. A brief poke above the boundary is weaker evidence when price immediately stalls or falls back.
Follow-through is what separates a cleaner breakout from a brief overshoot. A stronger continuation read usually depends on price remaining above the flag, with continued participation rather than an immediate drift back into the channel.
A breakout that holds above the former flag boundary is different from one that immediately retests and loses it. The first keeps the continuation read intact; the second shifts attention toward failed-breakout risk.
Invalidation follows a parallel logic. If price breaks below the lower boundary of the flag and stays there, traders often treat the bull flag setup as no longer valid. A deeper move back into the flagpole is a stronger form of invalidation, because it may suggest sellers have absorbed enough of the prior advance to change the read. Beyond that, broader context can invalidate a pattern without price touching the technical boundaries: a sharp market-wide selloff, a major macro event, or a sudden shift in conditions can all change the environment in which the setup was forming.
False breakouts are a recognized risk. A price move above the channel that looks like confirmation but quickly reverses into or below the flag can turn a bullish continuation read into a failed setup. That is why follow-through is part of how traders commonly describe confirmation.
Bull flag measured move: how target estimates are commonly framed
Once a bull flag breaks out, traders often use the flagpole's length as a rough guide for estimating where the move might go. This is commonly called the measured move.
The basic approach is to measure the flagpole, commonly the distance from the impulse or breakout that began the sharp rally to the high before the flag, and then project that distance from the breakout point. If a flagpole rises from $80 to $100, the flagpole length is $20. If price then consolidates in a flag between $96 and $100 and breaks above $100, a full flagpole projection would point toward a potential area near $120. A half-flagpole projection would suggest the $110 area. The projection is mainly a way to frame the possible continuation area; the actual move can stop short, overshoot, or fail before reaching it.
Some traders use the full flagpole. Others use a fraction. Neither approach carries a guarantee, and the right multiplier can vary by timeframe, volatility, and the character of the prior move.
The measured move is best understood as a reference area, not a price destination. Treating it as a prediction rather than a reference is one of the more common misapplications of the pattern.
Why bull flags fail
Bull flags fail often enough that the failure mode is part of understanding the setup. After a sharp rally, the line between a healthy pause and a fading move can be thin. A few patterns appear consistently.
Failed breakout that falls back into the flag. A price move above the upper flag boundary triggers what looks like confirmation, but price quickly slips back into or below the channel. This is one of the most common ways a bull flag disappoints. The breakout draws in buyers expecting continuation, and when follow-through does not materialize, the move can reverse faster than the setup implied.
The rally was exhaustion, not a flagpole. Not every sharp advance is a healthy flagpole. Some rallies are the final, accelerated push of a move that is already stretched. When the preceding trend has run a long way and the flagpole is the steepest part of it, the pause that follows can be the start of a top rather than a continuation. A bull flag drawn on an exhaustion move tends to break out weakly or fail outright.
Broad-market context reversal. A bull flag setup forming during broad buying pressure can be neutralized by a market-wide shift. If the broader market turns lower sharply, individual setups that looked like bullish continuations may resolve in the opposite direction.
Pattern drawn without enough prior context. A flag needs a distinct flagpole. When a trader draws a bull flag on a modest, gradual climb, the structure lacks the clarity that makes the pattern meaningful, and the breakout has little behind it.
Single-candle move treated as confirmation. A single breakout candle can overstate the setup when the next candles fail to continue. Without follow-through, the move may be only a brief overshoot.
Volume doesn't support the breakout. A breakout with little participation is more vulnerable to reversing. If price clears the channel but volume remains thin and follow-through disappears, the buying pressure implied by the pattern may not actually be present.
Bull flag vs similar patterns
A few bullish-looking structures can be mistaken for a bull flag, and the distinction matters because the setup and what traders watch for can differ.
Pattern | Shape | Key distinction |
|---|---|---|
Bull flag | Parallel or near-parallel consolidation after a sharp rally | Continuation setup after a flagpole; the channel is the key structural feature |
Bull pennant | Small converging consolidation after a sharp rally | Compression into a narrowing point rather than a channel; both walls slope inward |
Ascending triangle | Flat resistance with a series of higher lows | A resistance-test structure; not necessarily tied to a flagpole and operates differently across timeframes |
Exhaustion move | Sharp rally followed by weak or failed follow-through | Momentum may be fading rather than pausing, so a continuation read is less reliable |
The main distinction is shape and context. Flags have parallel or near-parallel channels after a flagpole; pennants compress toward a point; ascending triangles test a flat resistance level while building higher lows; and an exhaustion move looks like a flagpole that has simply run out of buyers.
The bear flag is the inverse concept. It forms after a sharp decline, pauses in an upward or sideways channel, and is read as potential bearish continuation when price breaks below the flag.
Common mistakes when reading bull flags
Treating any pullback after a rally as a bull flag. An uptrend contains many pullbacks. Most of them are not bull flags. The pattern requires a specific structure: a sharp prior move that forms a clear flagpole, a consolidation phase with recognizable channel boundaries, and a level that functions as either confirmation or invalidation. A vague dip after a rally without those features is just a dip.
Chasing the flagpole instead of waiting for structure. A fast advance is easy to overread, especially when momentum is visible before the consolidation has formed. But the bull flag setup is defined by the pause and the breakout that follows, not by the flagpole alone. Labeling the flagpole itself as the signal skips the structure the pattern is supposed to provide, and it can leave the read exposed just as the chart begins to consolidate.
Ignoring the invalidation level. A bull flag setup comes with a built-in disconfirmation level: the lower boundary of the flag, and beyond it a deeper move into the flagpole. Traders who identify the pattern but don't track when it has been negated can stay in a bullish read long after the structure has broken down in the opposite direction.
Treating the measured move as a promise. The flagpole projection is one way to estimate where a move might go. It is not a floor, a ceiling, or a guarantee. Markets can stop short, overshoot, or ignore the implied estimate entirely.
Confusing an exhaustion rally with continuation. Not every sharp advance is a flagpole with more room to run. When a move is already extended and the latest surge is its steepest part, the pause that follows may be the market topping rather than catching its breath. Labeling that setup a bull flag can lock in a bullish read just as momentum is fading.
