Bull Flag vs Bear Flag: Key Differences for Traders

Key Takeaways
Bull flags and bear flags are mirror-image continuation patterns. A bull flag forms after a sharp rally and points to a potential breakout above its flag; a bear flag forms after a sharp decline and points to a potential breakdown below its flag.
The practical difference is where confirmation would appear: above the upper flag boundary for a bull flag, and below the lower flag boundary for a bear flag.
Invalidation mirrors confirmation: a bull flag tends to weaken if price breaks below its flag, and a bear flag tends to weaken if price reclaims above its flag, with a deeper move back into the flagpole a stronger sign either setup has failed.
Both patterns use the same measured-move method, projecting some or all of the flagpole from the resolution point, in opposite directions. In both cases the projection is a reference area rather than a forecast.
Both patterns can fail through false breaks, weak follow-through, or poor context, so the comparison works best when confirmation and invalidation are read together.
Bull flag vs bear flag at a glance
A bull flag and a bear flag can look similar because both start with a sharp move and then pause. The difference is the direction of that move, the boundary price later tests, and the context around the consolidation. To separate them, traders first identify the prior move, then read the confirmation boundary. A bull flag frames possible upside continuation; a bear flag frames possible downside continuation.
The visual similarity is only a starting point. A cleaner read comes from checking the prior trend, the flag channel, the confirmation boundary, and the level that would invalidate the setup.
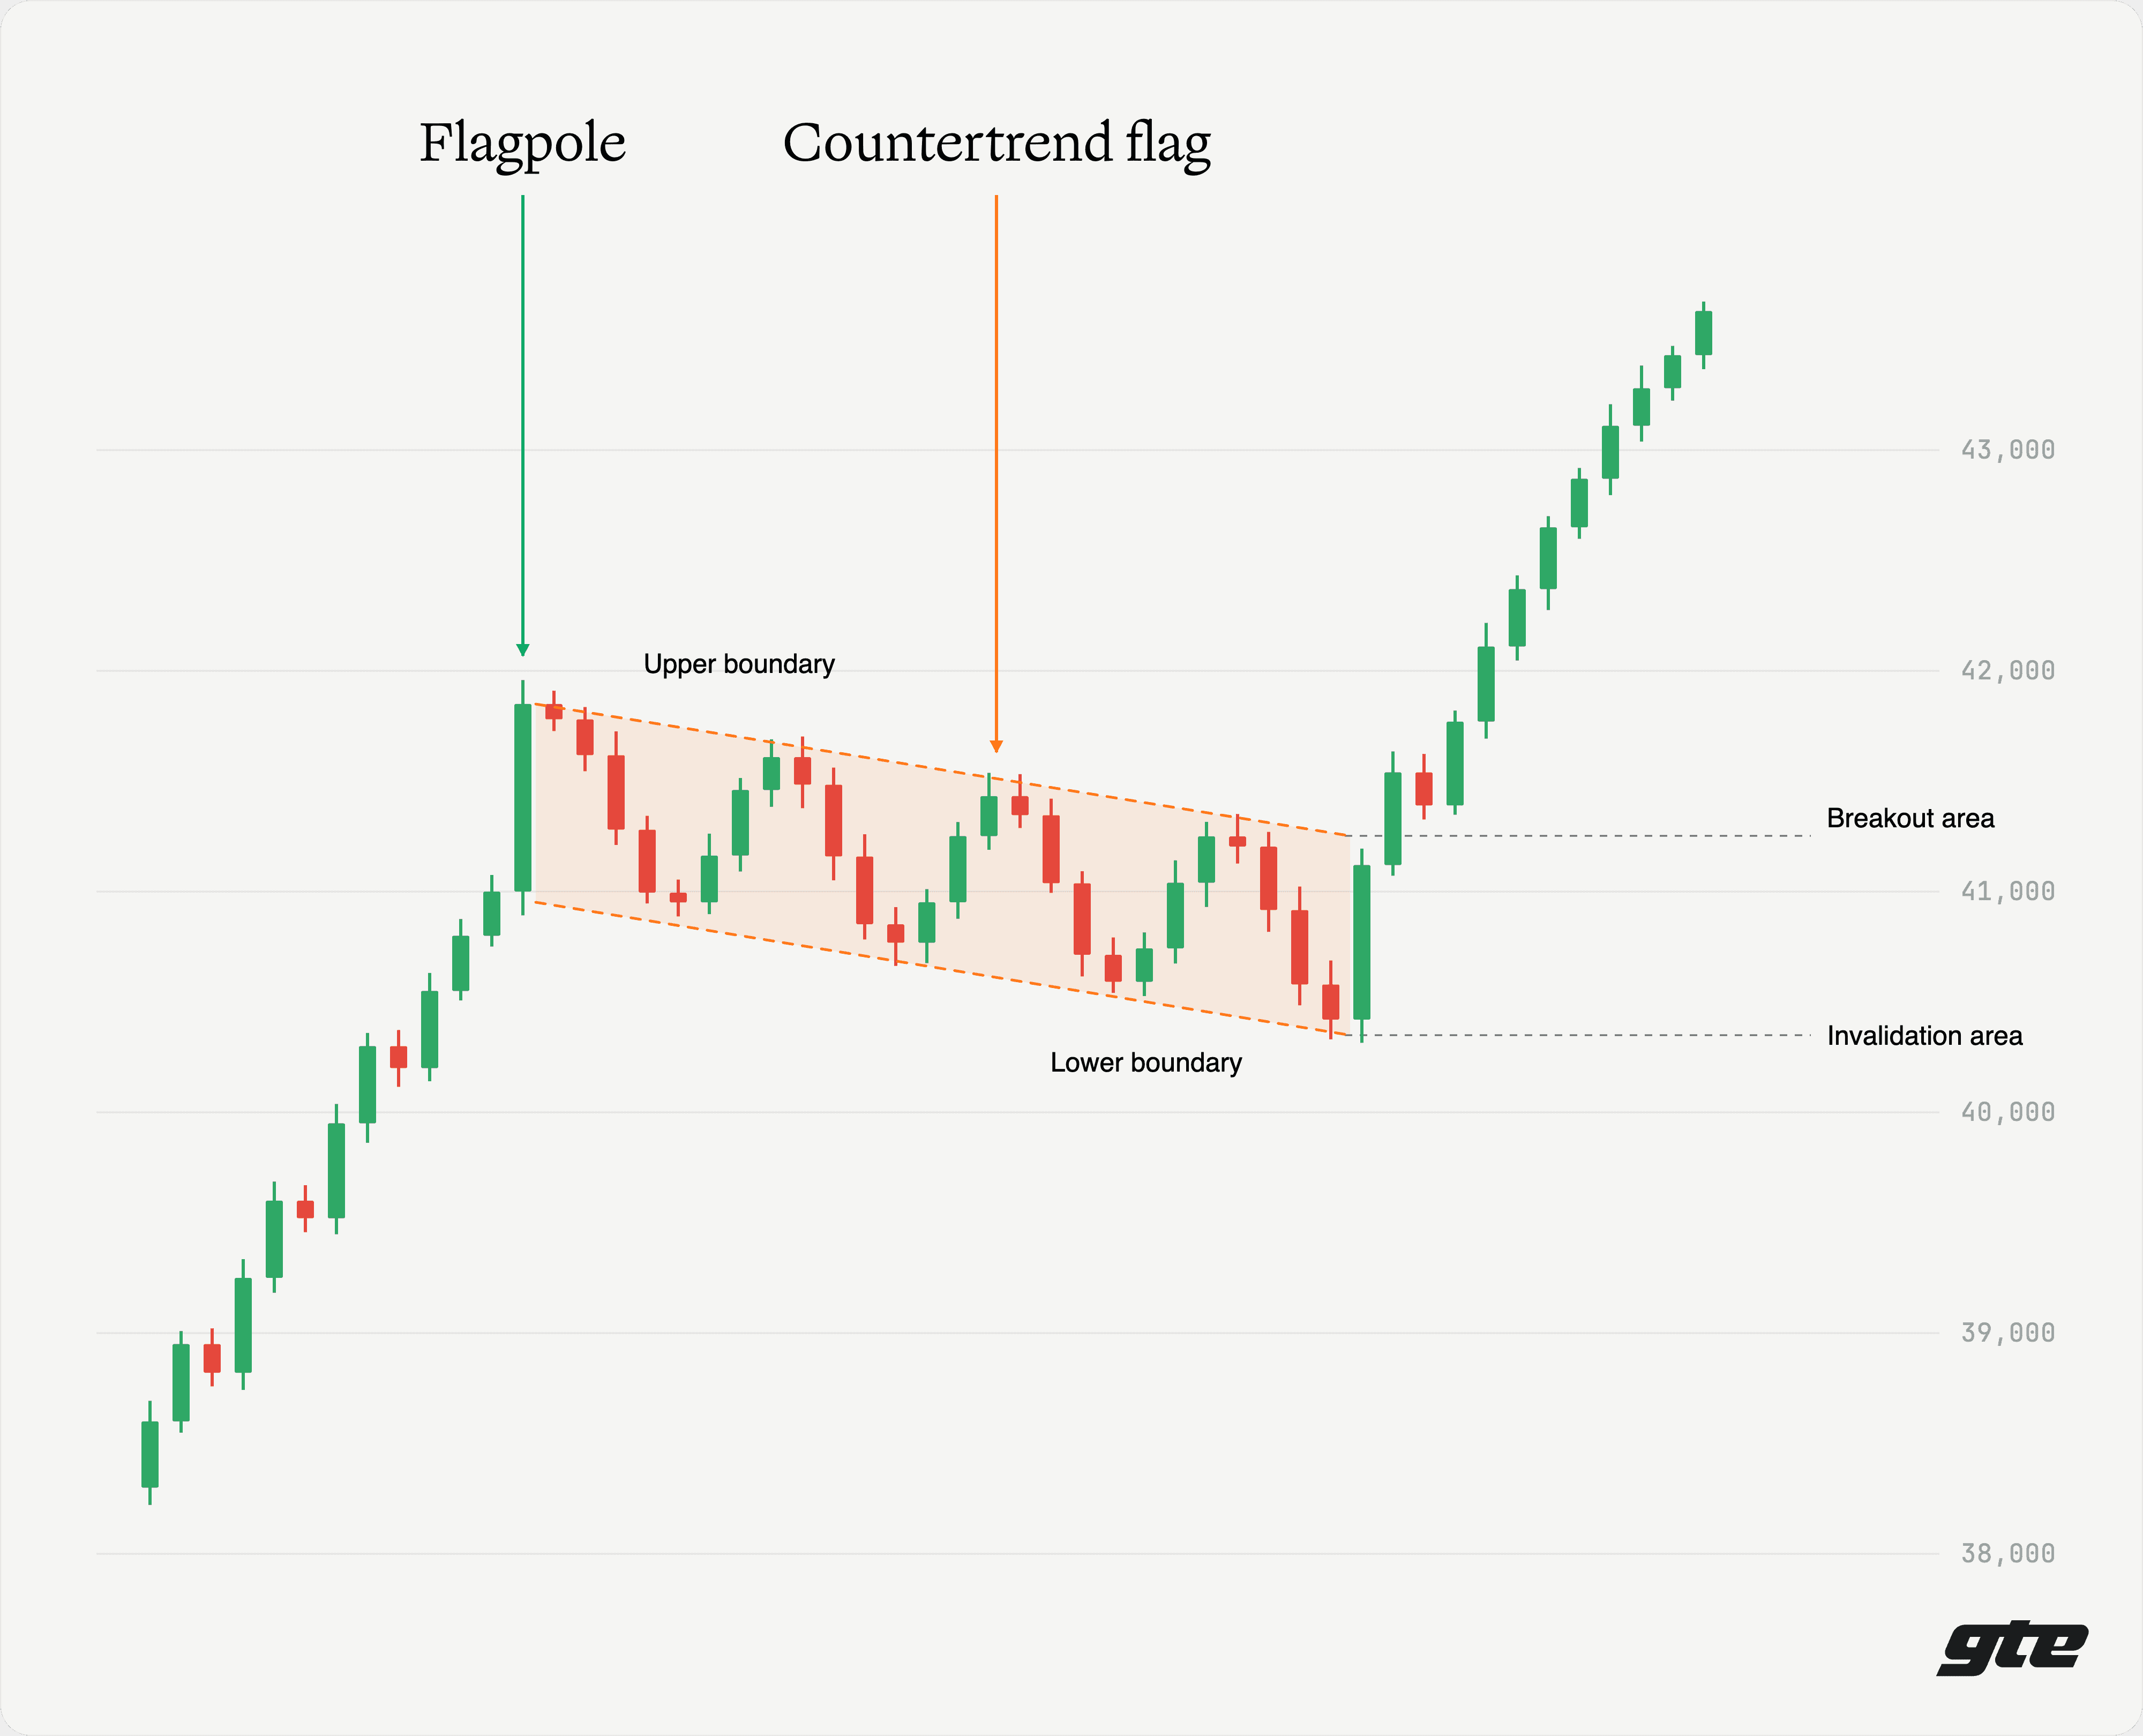
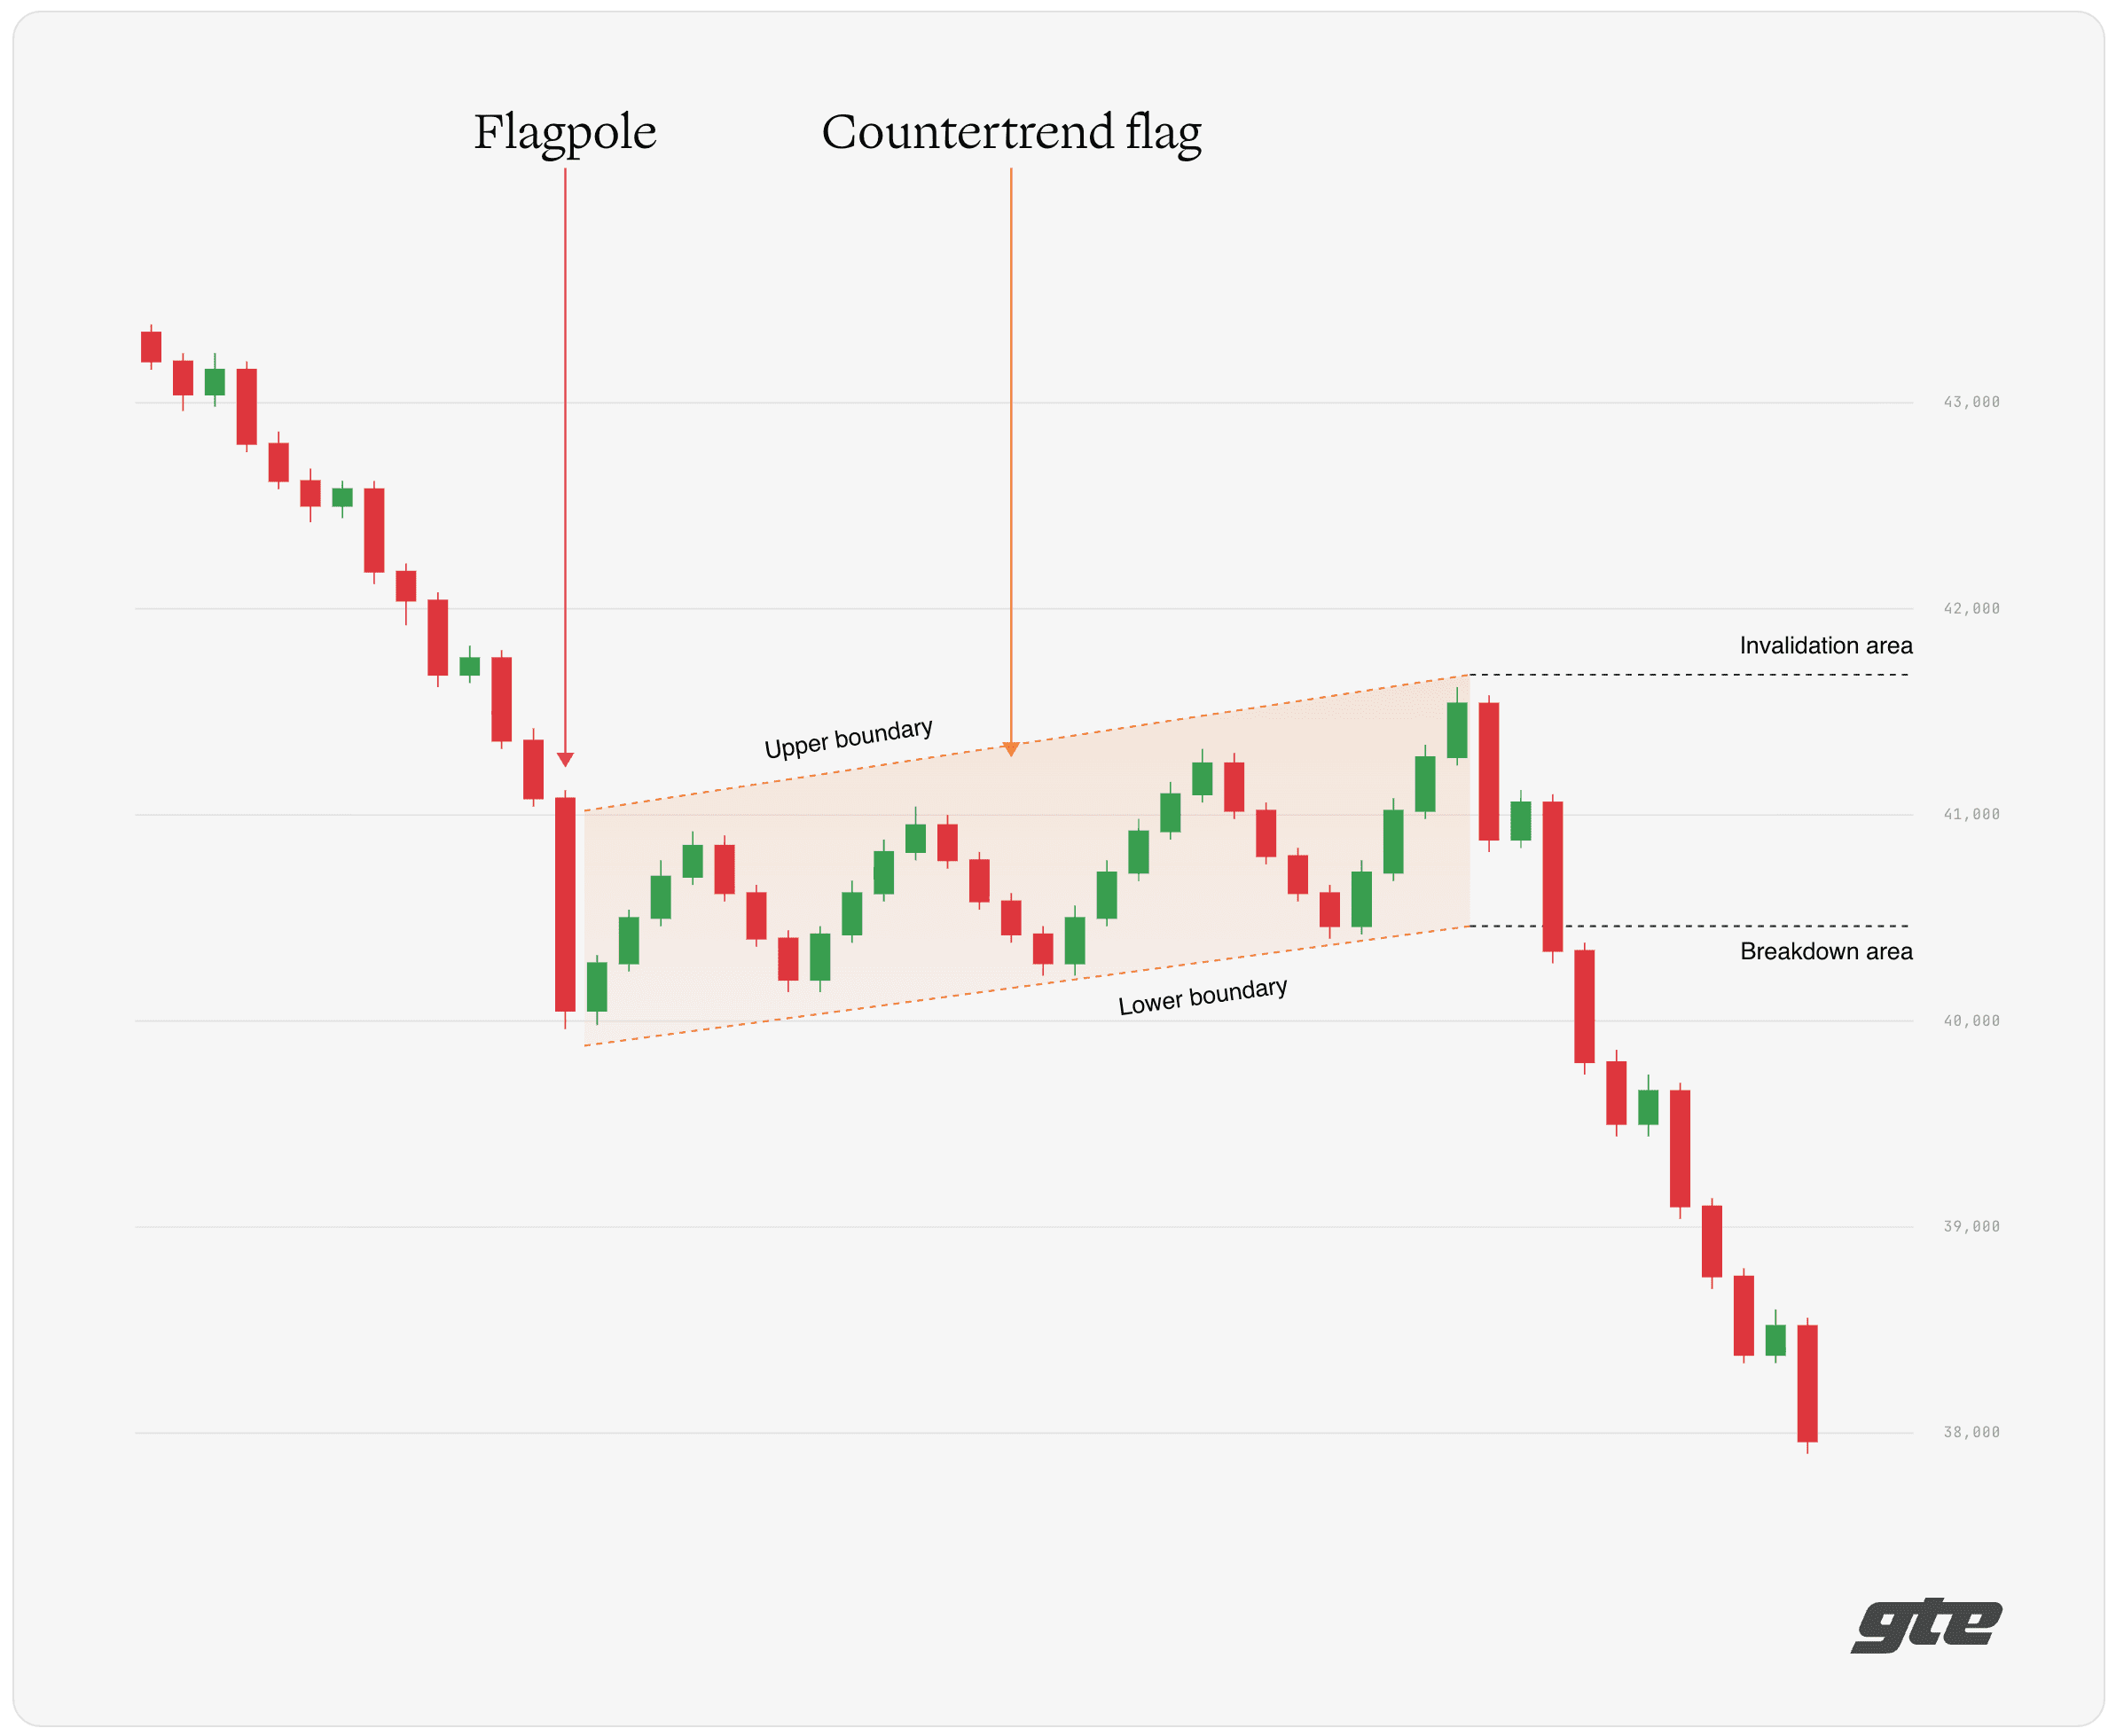
The bull flag example shows a sharp rally, a countertrend flag, and a breakout area above the upper boundary. The bear flag example shows a sharp decline, a countertrend flag, and a breakdown area below the lower boundary. In both examples, the opposite side of the flag marks the invalidation area.
The table below lines up the main points of comparison before each one is unpacked in more detail.
Dimension | Bull flag | Bear flag |
|---|---|---|
Market context / prior trend | Forms in an uptrend, after a sharp rally | Forms in a downtrend, after a sharp decline |
Flagpole direction | Sharp move up | Sharp move down |
Flag channel lean | Drifts down or sideways, against the prior up-move | Drifts up or sideways, against the prior down-move |
Confirmation event | Breakout above the upper flag boundary | Breakdown below the lower flag boundary |
Invalidation event | Holds below the lower flag boundary, or retraces deeper into the flagpole | Holds above the upper flag boundary, or recovers deeper into the flagpole |
Measured-move direction | Flagpole projected upward from the breakout | Flagpole projected downward from the breakdown |
Common failure risk | Rally may have been exhaustion rather than a pause | Consolidation may build higher lows into a reversal base |
Typical read | Possible continuation of an up-move | Possible continuation of a down-move |
Bull flag and bear flag basics
After the table, it helps to pin down the basic shape of each pattern before moving into the detailed differences.
Bull flag
A bull flag pattern is a bullish continuation setup that forms after a sharp rally. The initial advance is the flagpole; the smaller downward or sideways consolidation that follows is the flag. Traders typically watch the upper boundary of the flag for a breakout that suggests the uptrend may resume. For the full anatomy, formation logic, and measured-move example, see the dedicated bull flag article.
Bear flag
A bear flag pattern is a bearish continuation setup that forms after a sharp decline. The initial drop is the flagpole; the smaller upward or sideways consolidation that follows is the flag. Traders typically watch the lower boundary of the flag for a breakdown that suggests the downtrend may resume. The dedicated bear flag guide covers the full anatomy, formation logic, and measured-move example.
The key differences traders watch
Direction and market context
The most basic difference is the move each pattern is trying to continue. A bull flag forms after an up-move and asks whether the rally can resume after a pause. A bear flag forms after a down-move and asks whether the decline can resume after a bounce.
This is why the prior trend, not the flag itself, is where classification usually starts. The flag in both cases is a countertrend or sideways pause. What gives that pause its bullish or bearish meaning is the direction of the move that preceded it. A controlled channel that looks identical in isolation can belong to either pattern depending on whether a rally or a decline came first.
Setup sequence and flag lean
Both patterns share the same three-part sequence: a flagpole, a flag, and a resolution. The flagpole is the sharp directional move. The flag is the smaller consolidation that follows. The resolution is the breakout or breakdown that either continues the move or shows the setup is failing.
The easy mistake is reading the flag lean as the signal. In both patterns, the flag usually moves against the prior move or sideways. A bull flag forms after a rally, so its flag often drifts slightly downward or sideways. A bear flag forms after a decline, so its flag often drifts slightly upward or sideways. When the flag is angled, that slope is usually countertrend; it is not the directional signal by itself. This is why the prior move has to come first.
Confirmation: breakout vs breakdown
This is the cleanest mirror between the patterns. For a bull flag, confirmation usually means a breakout above the upper flag boundary; for a bear flag, it means a breakdown below the lower boundary.
Traders tend to give more weight to a candle close and follow-through than to a single wick through the boundary. A brief poke past the level that immediately reverses is weaker evidence than a close beyond it that holds, because wicks can reflect momentary liquidity grabs rather than durable direction. The boundary that matters is opposite for each pattern, but the standard of evidence is the same: a held break with participation behind it, not an isolated spike.
Invalidation
Invalidation works from the opposite side of the flag. A bull flag tends to weaken when price breaks below the flag instead of continuing higher. A bear flag tends to weaken when price reclaims above the flag instead of continuing lower.
In both patterns, a shallow break against the expected direction is a softer warning, while a deeper move back into the flagpole is a stronger sign the setup has failed. In a bull flag, a drop toward or below the start of the rally suggests much of the prior advance has been absorbed. In a bear flag, a recovery toward or above the start of the decline suggests much of the prior selling has been absorbed. Broader context can also invalidate either setup without price touching those technical levels, since a sharp market-wide move or a major macro event can change the environment the pattern was forming in.
Measured move
Both patterns estimate a potential continuation area the same way: measure the flagpole, then project some or all of that distance from the resolution point. The only difference is direction. A bull flag projects the flagpole upward from the breakout; a bear flag projects it downward from the breakdown.
In either direction, the measured move is only a reference area, not a price destination or a forecast. Price can stop short, overshoot, or fail before reaching it, and traders may use the full flagpole or only a fraction depending on timeframe and volatility. For a deeper walkthrough of each setup, see the bull flag measured-move method and how bear flag targets are estimated.
A practical three-step read
When the two patterns are hard to separate on a chart, a practical way to classify them is to read the structure in order rather than judging the flag in isolation. Traders generally work through three checks.
First, identify the prior trend. Look at the move that came before the consolidation. A sharp rally points toward a bull flag; a sharp decline points toward a bear flag. That first step often narrows the read, because the prior trend assigns directional meaning to everything that follows.
Second, read the flag channel. A bull flag's channel usually drifts down or sideways after the rally; a bear flag's channel usually drifts up or sideways after the decline. If the channel keeps pushing in the same direction as the flagpole, the structure may be something other than a clean flag.
Third, watch which boundary is being tested. A bull flag is testing for confirmation at the upper boundary; a bear flag is testing for confirmation at the lower boundary. A cleaner read usually requires price to break and hold beyond that boundary, not merely touch it.
The goal is classification, not a trading instruction. Once the structure is labeled correctly, confirmation, invalidation, and measured-move logic become easier to interpret.
Common mistakes and failure modes
One trap in comparing these patterns is assuming the mirror is perfect. The structure is largely symmetric, but some failure risks show up differently on the bullish and bearish sides.
Assuming the mirror is perfect. Bull flags and bear flags share several failure modes, including false breaks, weak follow-through, and poor pattern context. Some risks, however, show up more naturally on one side than the other. A bull flag can fail when the prior rally was exhaustion rather than a pause, especially if the move has already run far and the latest push is the steepest part of the trend. A bear flag can fail when its consolidation starts building higher lows, turning what looked like a countertrend pause into a reversal base.
Mislabeling direction from the flag channel. Because a bull flag often drifts down or sideways and a bear flag often drifts up or sideways, a reader who fixates on the channel alone can invert the pattern. The prior trend and the boundary being tested carry the direction.
Treating the measured move as a promise. The flagpole projection is a way to frame a possible continuation area, not a floor, a ceiling, or a guarantee. Price can stop short, overshoot, or ignore the estimate entirely. This applies equally to both patterns.
Forcing a flag label onto a different structure. Not every consolidation after a strong move is a flag. A pennant, a triangle, or a base can all be mislabeled as a flag when the channel boundaries are not actually parallel or the prior flagpole is not clean. A bull flag whose flag drifts into a flat-resistance shape with higher lows may be acting more like an ascending triangle, and a bear flag whose flag tests flat support with lower highs may be acting more like a descending triangle. Applying the wrong label to the structure can lead traders to watch the wrong boundary for confirmation.
